Which Airlines Have the Most Full Flights?
Ever wondered which airlines have the most passengers? Well, there’s no need to guess! Each month, the Australian government publishes information revealing exactly how full each airline’s international flights are.
In September 2018, for example, we know that Qantas’ flights to Chile, Indonesia, South Africa and the UK were standout performers, with more than 90% of seats filled on average. Meanwhile, Virgin Australia did not have average loads above 90% to any of its international destinations, and the airline’s new flights to Hong Kong are struggling with around a 61% load factor. Virgin’s top-performing route was Australia to Bali, with 86% of seats occupied. The airline with the lowest passenger loads was Donghai Airlines, which filled just 36% of seats.
During September, low-cost carriers accounted for just 14.6% of international airline traffic out of Australia – which is down from last year. The busiest international route was Sydney-Auckland, followed by Sydney-Singapore and Melbourne-Singapore. And the airline with the most market share was Qantas, carrying 16.9% of international passengers to or from Australia. This was followed by Jetstar, Singapore Airlines, Emirates and Air New Zealand.
Monthly BITRE International Airline Activity reports contain all this information, plus much more. The most recent report reveals data from September 2018 – a period which includes the busy first week of the spring school holidays. The statistics make for some interesting reading and often reveal some surprising trends.
The BITRE International Airline Activity data is freely available to the general public on the BITRE website. Probably the most interesting statistics are the “seat utilisation” figures. These tell us what percentage of seats were occupied by paying customers (including passengers travelling on frequent flyer redemption tickets). This tells us a lot about how each airline and route is performing.
There are some limitations to these statistics. For example, they don’t tell us exactly how profitable a route is, as this depends also on “yield”. In other words, an airline with fewer filled seats could still be making more money than its competitor if it charges higher fares. An airline’s costs can also play a role. And where an airline flies to multiple destinations to the same country (e.g. Qantas flies to both Shanghai and Beijing in China), the data does not reveal which specific routes are performing best. Nonetheless, the BITRE International Airline Activity stats can paint a useful picture.
Interested to know which airlines had the busiest international flights in September? Here are the average airline load factors between Australia and 7 countries. The results may surprise you…
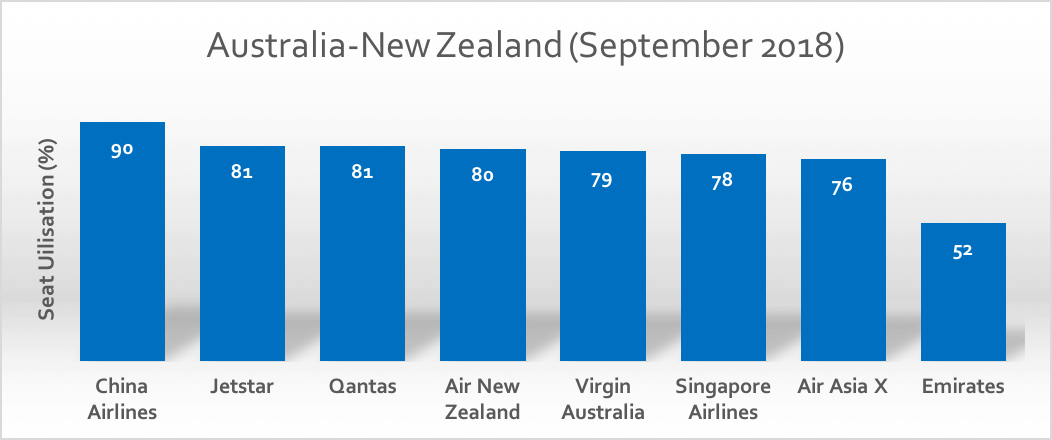
Australia to New Zealand
Most airlines filled around 4 out of 5 of seats across the Tasman… except Emirates, which is a surprise under-performer on the Sydney-Christchurch route.
Australia t0 China
Jetstar (flying Melbourne-Zhengzhou) and Donghai Airlines (Darwin-Shenzhen) are clear underachievers between Australia and China.
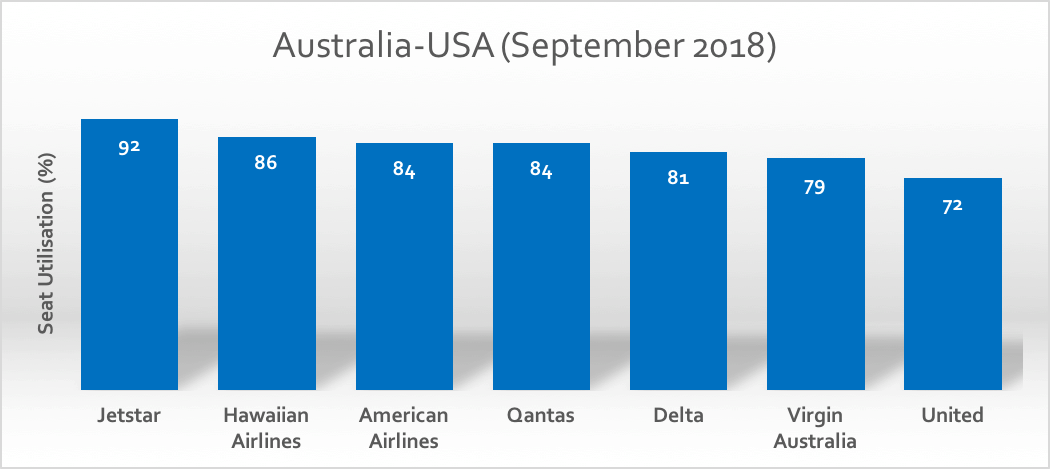
Australia to United States
Jetstar and Hawaiian Airlines enjoy healthy loadings on their flights to Hawaii. Meanwhile, United is the weakest performer on flights to mainland USA.
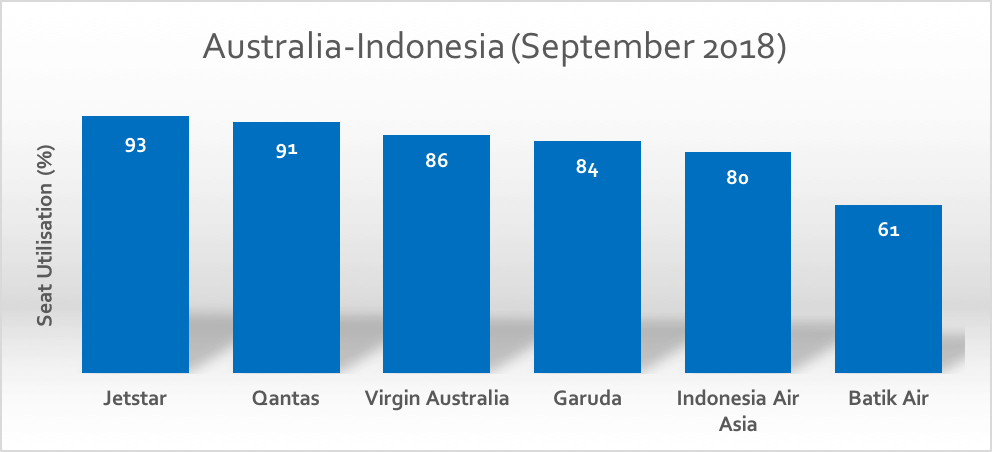
Australia to Indonesia
Jetstar maintains a solid market share on Australia-Bali flights.
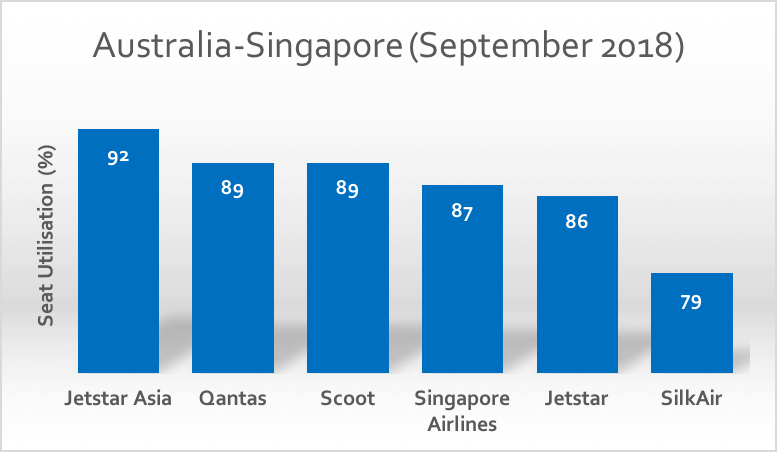
Australia to Singapore
Passenger loads to Singapore are relatively healthy across all airlines.
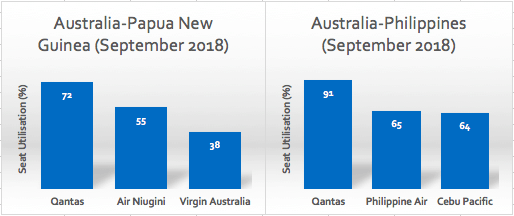
Australia to Papua New Guinea & Australia to The Philippines
On flights to Port Moresby and Manila, Qantas flights are significantly more full than competitors’. Virgin’s load factors on the Brisbane-Port Moresby route are particularly low.
Join the discussion on the Australian Frequent Flyer forum: BITRE September 2018 international passenger statistics
