Depends on whose purpose it is trying to serve
Partly
What is the usual way population is divided other than Sex? ---Age.
Basically the point is it is important to compare cohorts rather than assume the population is homogenous
Using the latest NSW
covid surveillance report for the period of 28Nov21 to 8Jan22
Hospitalisation % according the Vaccination cohort
(a) The hospitalisation %:
- 2Jab positives = 1% of the total Covid+ who were 2Jab
- 0Jab positives = 9% of the total Covid+ who were 0Jab
The ICU %:
- 2jab 0.1%
- 0Jab 1.5%
The death %:
- 2Jab 0.025%
- 0Jab 0.6%
So basically what the report says is that even if 0Jab, if you become Covid+ there is a 6/1000 chance of dying overall but which is 24 times more than if 2Jab.
Now to some people 6/1000 is a small number but 24x is a big number. How should it be reported?
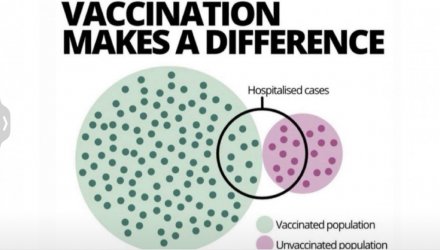
The graphic earlier shows the big and small circle with dots suggesting that 50% of the people in the Unvaxxed group are hospitalised (count the dots). This is patently untrue. The rate being 9%. Of the 9 dots you can round up to 1 dot (actually 0.8 dots) for the hospitalisation rate for the unvaxxed.
On the other hand the big circle suggests 7% (9/115) dots) of the vaccinated will be hospitalised when in fact it is 1%. About 2 dots in total.
The graphic should have hospitalisation dots as 1 for unvaxxed and 2 for vaxxed.
(Now some of the "under investigation" cohort where the number of Jabs are unknown would be in the 0, 1, 2jab cohort so are not included)
Then you add in age which is how you would categorise a population
Lets take the 70-90+ age group and same period 26Nov21-8Jan22 and look at severe outcome = Table 6 (ICU and or death)
Overall total Covid+ in 70-90 age group = 11104 (whether hospitalised or not)
- 2Jab = 10991 = 4.1% of the entire 2Jab Covid+ cohort of NSW
- 0Jab = 113 = 0.3% of the entire 0Jab Covid+ cohort of NSW
Importantly of the total of 301660 cases of Covid+ in NSW 3.7% are in the 70-90 age group
The Severe outcome rate of the 2Jab 70-90 age group is 0.05% of the entire NSW cohort who is covid+
The Severe outcome rate of the 0Jab 70-90 age group is 0.008% of the entire NSW cohort who is covid+
However when comparing the % of severe outcome ICU/deaths between vax groups within the 70-90 age group:
- 2Jab = 1.3%
- 0Jab = 21% = 16x that of 2jab
Now go back to see the Covidlive picture I posted above.
Point is that just looking at a Media created metric does not tell the full picture and potentially misleading.
The Big picture:
1)The ICU rate compared to overall covid+ is very small regardless of Vax status
2) Unvax status = 16-24x higher chance of bad outcome in in the elderly despite what a superficial reading of Covidlive suggests
3) The hospitalisation rate is a lot smaller for both Vaxxed and Unvaxxed group than what the 2 circle graphic suggests. Hospitalisation circle = 1 dot in unvaxxed circle and 2 dots in vaxxed circle rather than 9 for both
I'll let you work out similar for the other age groups.


