General COVID-19 Vaccine Discussion

Status
Not open for further replies.
Also doesnt look like much correlation between vaccine uptake between countries or US counties.
As the report indicates, it's highly dependent on reported cases and population activity. So fairly meaningless.

But, I'll still seek out my 5th jab.
 
Though Pfizer should have increased the interval over 12 months ago when that evidence first came out. AZ increased their interval from 3 to 12 weeks at that time. Though they did cop some uninformed criticism for that move.
The UK government did increase the interval for mRNA vaccines at that time as did Canada.
 
Give SA it's due. It is the correct decision and is following the science. I am impressed with your new Premier. He is making some good decisions. Obviously he won't get everything right but he well in front at the moment.
 
EXCLUSIVE OFFER - Offer expires: 20 Jan 2025

- Earn up to 200,000 bonus Velocity Points*
- Enjoy unlimited complimentary access to Priority Pass lounges worldwide
- Earn up to 3 Citi reward Points per dollar uncapped

*Terms And Conditions Apply

AFF Supporters can remove this and all advertisements

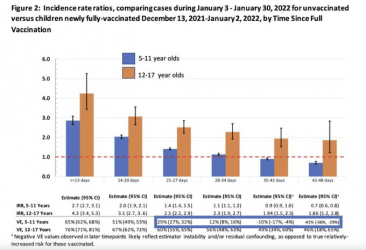
Results of another study on vaccination for 5-11 year olds. This is from JAMA.
1652584803729.png.

So in 5-11 year olds from 5 weeks after second shot vaccine effectiveness -10%. Yes that is minus 10%.
But it gets worse after 6 weeks with effectiveness -41% (minus 41%)
 
Results of another study on vaccination for 5-11 year olds. This is from JAMA.
View attachment 277270.

So in 5-11 year olds from 5 weeks after second shot vaccine effectiveness -10%. Yes that is minus 10%.
But it gets worse after 6 weeks with effectiveness -41% (minus 41%)
What exactly does that mean then? More vulnerable?
 
We’re virtually 100% vaccinated. How much more can we do? This is now it. As mild as a cold, a mortality rate of less than 0.1% (0.03% in WA which released it with a higher vaccination rate). Amazing that people are still aspiring for “covid zero”.
Current mortality rate (for positive tests reported) is currently running between 1 in 500 and 1 in 900 reported positive tests, and has been for some time. Given that the number of dead since even the annoucement of the Federal Election campaign is fast appraoching the total number who died from the start of 2020 through to 1 November 2021 - the number of deaths per day are an order of magnitude greater than in that period.

Colds do not have a mortality rate of 1 in 500 to 1 in 900.
 
N
What exactly does that mean then? More vulnerable?
No. Subjective quoting of parts of the paper. The paper itself is about pfizer study,


is not peer reviewed and does not give that as a conclusion.

IMHO: AFF should stop these silly discussions and selective quoting of data.
 
N

No. Subjective quoting of parts of the paper. The paper itself is about pfizer study,


is not peer reviewed and does not give that as a conclusion.

IMHO: AFF should stop these silly discussions and selective quoting of data.
Sorry but the graph I took was from JAMA -Journal of the American Medical Association. A peer reviewed journal. Most articles now are pre published in non reviewed sites for quick access.
However you might have read a couple of previous links which are of the opinion that saying something is peer reviewed today is basically implying nothing.
Whats the reference to the original paper then? Again, “conclusions” from the selective quote are not supported.

Quote the references to support your selective assumptions of the research.
 
Current mortality rate (for positive tests reported) is currently running between 1 in 500 and 1 in 900 reported positive tests, and has been for some time. Given that the number of dead since even the annoucement of the Federal Election campaign is fast appraoching the total number who died from the start of 2020 through to 1 November 2021 - the number of deaths per day are an order of magnitude greater than in that period.

Colds do not have a mortality rate of 1 in 500 to 1 in 900.
1652589609509.png
 
Whats the reference to the original paper then? Again, “conclusions” from the selective quote are not supported.

Quote the references to support your selective assumptions of the research.

The graphs are downloads which on my little travel computer I haven't learnt how to link.
 

The graphs are downloads which on my little travel computer I haven't learnt how to link.
Your selective reading of either study and analysis of the statistics and conclusions of the study are not valid.

”Our data support vaccine protection against severe disease among children 5-11 years, but suggest rapid loss of protection against infection, in the Omicron variant era. Should such findings be replicated in other settings, review of the dosing schedule for children 5-11 years appears prudent. At this time, efforts to increase primary vaccination coverage in this age group, which remains <25% nationally, should continue. Given rapid loss of protection against infections, these results highlight the continued importance of layered protections, including mask wearing, for children to prevent infection and transmission.”

The graph actually comes from a third party pharmaceutical study.

And from the editorial comments from your quoted article,

”The encouraging message should be that although vaccine protection for children and adolescents was lower in the Omicron era than with previous variants and that such protection wanes rapidly, vaccine effectiveness against hospitalization remains high and booster doses confer additional protection.”

ref:Protecting Children Against Omicron
 
Last edited:
Meanwhile others are saying that official estimates are that less than 1 in 3 or 1 in 4 are reporting positive RAT results for many reasons such as no longer covered for lost income, not wanting their children to be off school etc. This was why the testing in NSW schools at the start of Term 1 was dropped - too many parents refused to do them. Many articles covered that - so, given there are no 'test result' police checking to see everybody is doing a test (when they have symptoms - even though the bulk of people remain asymptomatic & there is no longer surveillance testing) - makes it very low credibility for Dr Coatsworth's claim on those grounds alone.

BTW Australia has one of the most restrictive definitions for listing a death from Covid. Some OECD countries include deaths from Covid-related illness in the month following a positive test result (for example).

Equally not so sure about high quality data collection when 331 deaths are added to the official number in NSW (ALONE) with the bulk of them (270) covering the first three months of 2022 in NSW. Made the trajectory look very different to what was being presented at the time.

NSW Health were aware of positive test results from 256 of the 331 deaths, but had not received reports of those deaths. They did not have a record of a positive test results from the remaining 75.

Reason for 'revision' was 'poor quality data collection' and 'data not transferring across systems'. The revision increased the number of deaths in NSW by 16%. Very much at odds with Dr Coatsworth's claim.

Back to what I originally posted:

Current daily number of announced Covid deaths (pre future revision additions) stands at between 1 in 500 and 1 in 900 per daily reported new positive results - far in excess of the death rate from a cold in Australia.
interesting article. Australia led the world in COVID infections this week and the experts say 'it's not over'

These seem to be the best statistics.

 
Last edited:
  • Agree
Reactions: RAM
interesting article. Australia led the world in COVID infections this week and the experts say 'it's not over'

These seem to be the best statistics.

A couple of things in interpretation of the above article.

In the first year of the pandemic the Australian annual total death rate actually fell, almost certainly because people in their last few years of life were being shielded from the usual other infections that precipitate their final demise. It is to be expected that the death rate will correct back to the mean, and with covid being so prevalent many of these deaths will be in the context of a covid infection.

It is simply not credible that 10% of the (predominantly clinically mild) covid infections will result in long-covid symptoms. While it is true that chronic fatigue type illnesses can begin with modest viral illness, the international comparison data is coloured by people experiencing serious multiorgan illness in the context of unvaccinated covid.

The best way of avoiding long-covid is to be vaccinated though it will not be a guarantee.

My own view is that general community well-being is now (in a very highly vaccinated population) best served by leading a reasonably normal life.

Those who are personally worried about the effects of covid can of course continue to wear an effective N95 mask which will likely reduce their risk of contraction
 
Your selective reading of either study and analysis of the statistics and conclusions of the study are not valid.

”Our data support vaccine protection against severe disease among children 5-11 years, but suggest rapid loss of protection against infection, in the Omicron variant era. Should such findings be replicated in other settings, review of the dosing schedule for children 5-11 years appears prudent. At this time, efforts to increase primary vaccination coverage in this age group, which remains <25% nationally, should continue. Given rapid loss of protection against infections, these results highlight the continued importance of layered protections, including mask wearing, for children to prevent infection and transmission.”

The graph actually comes from a third party pharmaceutical study.

And from the editorial comments from your quoted article,

”The encouraging message should be that although vaccine protection for children and adolescents was lower in the Omicron era than with previous variants and that such protection wanes rapidly, vaccine effectiveness against hospitalization remains high and booster doses confer additional protection.”

ref:Protecting Children Against Omicron
Well the graph was included in the article by the Authors.
Second the evidence they present really doesn't stack up with their conclusions.
Within a month after 2 vaccinations in the 5-11 year old group effectiveness fals below 50%. Why is that important. Because that has been the standard for vaccine studies for many years. If the efficacy is below 50% authorisation of the vaccine will not proceed.
So there is not substantive evidence for the vaccine to dramatically reduce infection and transmission.

Then comes the part about reducing serious disease in children. Their study notes in the 5-11 year group hospitalisations are reduced 50 %. But how prevalent are hospitalisations in healthy 5-11 year olds.Probably very few.

We do have numbers for deaths. For those under 17 there have been 934 deaths in the USA during the pandemic out of the 73 million under 17. Now the majority of those deaths are those with co morbidities. Particularly in young children they are neurological dise including Cerebral Palsy and genetic neurological diseases. Also Immune deficiency and there are a few genetic immune deficiency diseases.

So it is probably about 400 healthy youngsters that have died of covid and that will include the obese as healthy.
Now antibody studies reveal 78 % of Americans have had exposure to Covid 19. It is more frequent in younger age groups but just taking the 78% means 56.94 Americans under 17 have been exposed to covid. That makes their mortality rate 0.0007%. Reducing that by 50% isn't going to save large numbers.
 
Well the graph was included in the article by the Authors.
Second the evidence they present really doesn't stack up with their conclusions.
The authors did not actually do a study for the graph but quoted earlier work In their review. Completely disagree with your statements. You are subjectively imposing your view on a study that doesn’t support your ”opinions”. Why don’t you just enjoy your SIN vacation rather than disagree with authors of the original paper?
 
The authors did not actually do a study for the graph but quoted earlier work In their review. Completely disagree with your statements. You are subjectively imposing your view on a study that doesn’t support your ”opinions”. Why don’t you just enjoy your SIN vacation rather than disagree with authors of the original paper?
Medicine is never black and white. The authors are stating their opinions and I and quite a few others are able to state our differing opinions. That is particularly when people rely on percentage reductions when the numbers themselves are very low.
 
Medicine is never black and white. The authors are stating their opinions and I and quite a few others are able to state our differing opinions. That is particularly when people rely on percentage reductions when the numbers themselves are very low.
The authors of both studies are more suited, date I say qualified, to form a conclusion than your opinion, and AFF is not the place to promote misinformation or unsupported opinions.
 
Status
Not open for further replies.

Become an AFF member!

Join Australian Frequent Flyer (AFF) for free and unlock insider tips, exclusive deals, and global meetups with 65,000+ frequent flyers.

AFF members can also access our Frequent Flyer Training courses, and upgrade to Fast-track your way to expert traveller status and unlock even more exclusive discounts!

AFF forum abbreviations

Wondering about Y, J or any of the other abbreviations used on our forum?

Check out our guide to common AFF acronyms & abbreviations.
Back
Top