Wonderful statistics trick - comparing 'stocks with flows'. Even better when you only use 'net flows'.
Similarly NSW Health does not provide the number of new admissions to hospital each day - they provide a 'net figure' which represents:
# new cases admitted
less # of deaths (in hospital & in 'hospital in the home)
less # of cases moved to HITH
less # of cases fully discharged
Comparing the net additions to hospitalisations is close to meaningless.
The same goes for ICU admissions and those on ventilators.
For example yesterday's ICU admissons stood as 184 with 119 deaths over the week (less those aged 90 or over), an unknown number who thankfully have improved sufficiently to be taken out of ICU.
Taking the number announced on Thursday of 29 deaths, 5 were in their 90s, of the remainder none were said to have died at home. The 'net' ICU number only increased by 2 from the day before.
The minimum number of new admissions to ICU was 2 + 24 = 26. Taking into account the 'typical stay' in ICU of (conservatively) 5 days then around 1/5th of the previous day's figure is around 36 people would have gone from ICU. For that day's reporting then 24, of the likely 36, died and 12 moved to other wards.
Total likely new admissions to ICU = 2 + 24 + 12 = 38 people, or roughly 21% of the total number
SMH opinion piece:
Hospitalisations are still growing but at a slower rate, and both bed and intensive care numbers are tracking just below best-case scenarios. But there are lessons we must learn from this outbreak to help us in the next wave.

www.smh.com.au
" most intensive care beds are occupied by patients infected with the Delta strain or patients who are unvaccinated"
"In Australia, about 1 per cent of diagnosed Omicron cases are hospitalised, compared to 3 per cent for Delta. Intensive care unit admission among the hospitalised is less common, and among those requiring intensive care, ventilator support is also less common."
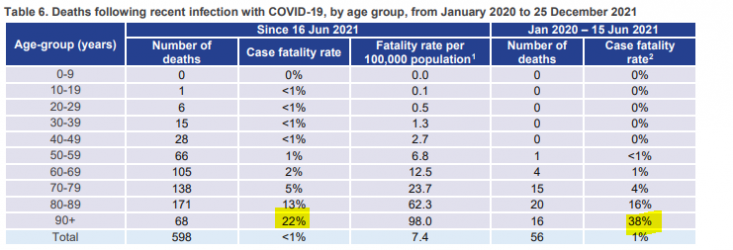
Given the around fifteen fold increase in weekly deaths (8 in week ending Dec 25th vs 126 last seven days, or 119 adjusted for 7 older cases) and that
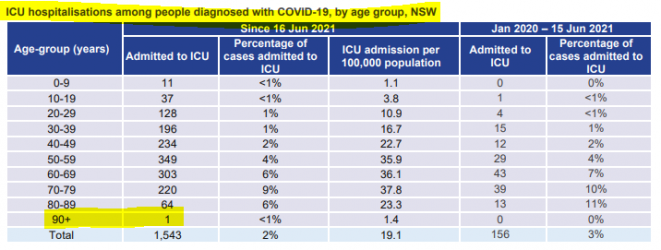
in NSW people aged 90 years or older with Covid-19 are refused admission into ICU let alone ventilated - then any comparisons for ICU, ventilator are equally understating the reality given the high rate of 90+ year olds who have died in the last week and other weeks.
NSW Health states (in its reports) that there is typically a ten to fourteen day lag between initial diagnosis & hospitalisation and a 21 to 28 day lag from diagnosis to deaths. Using the average daily case figures from 21 to 28 days ago for the 29 deaths announced Jan 14 - yields a mortality rate of 29 / 3,671 = 0.8%.
So as not to be accused of cherry picking. Doing the sums for the 7 day Moving Avg of daily deaths (adjusted) = 17 / day over the last 7 days and the similar MA of the rolling 7 day case # MA, yields a mortality rate of 0.7% which coincidentally (?) rounds to be about 1 per cent of Omicron cases detected over the relevant periods.
The last 7 days mortality rate is higher (and has skewed the overall rate higher) than the mortality rate for Covid-19 from the start in Australia. Let's hope this trend in mortality rates is short lived.
461,003 resolved cases and 2,578 deaths = 0.6%. Taking out the 4 week's figures see the pre-'Let it rip' mortality rate = 0.5%.
Avg ICU end of day
w/e 14 Jan = 167 vs w/e 7 jan = 107, increase of 56%
Avg Deaths
w/e 14 Jan = 17 vs w/e 7 Jan = 5, increase of > 300%


