Australian Reports of the Virus Spread

Status
Not open for further replies.
A couple of Tier 1 sites in regional Victoria, let’s hope Dan holds his nerve as they only opened back up yesterday
I'm not sure that holding his nerve is something Dan has ever done. But, given that he's been partial to calling wolf, I wonder if there would be a great deal of compliance now, no matter what he does.
Yes I wonder where the politics will go now. Dan said he was going hard and early to avoid being like NSW. Oh wait....! Regardless the prohibition of Victorians currently in NSW from returning looks more and more pointless now.
Oh, he's been pretty good at punishing those who live on the border. I suspect it plays well in Melbourne, and the regions don't vote for him anyway.
I personally believe Australians are so fatigued by everything and our extended experience over the months gone by that even in the little states, that once they, their family/friends are double vaxxed - that is it.

They have done their part and now are prepared to accept whatever happens happens, what else can you do to protect yourself and let’s get on with it.
Once double vaxxed there is nothing most of us can do. So, we want our lives back, otherwise we're accepting faceless bureaucrats and politicians have permanently stolen them. During our just ended lockdown, the lack of compliance was much more obvious than it has been in the past. Once people believe that the restrictions won't be removed irrespective of what they do, then why bother complying at all.
 
For NSW, it could be read into yesterday's NSW Health Minister's comments to go to the beach where its safer - a day at the beach would involve less testing, given the test protocol would be to isolate until you get a result.
 
And a big down day for NSW with 1262 (vs 1599 yesterday)
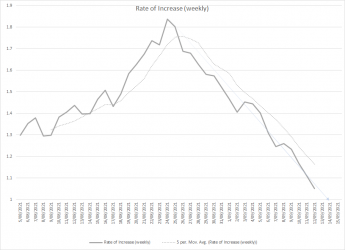
Trend is more important than the ups and downs. This below maps the week on week rate of increase of cases based on a 5 day moving average, the trend is remarkably consistent for about 3 weeks now and we are due to get rate of increase below 1 which will mean numbers start to go down. Yes, we will have up days and down days within that (i.e. to be specific we may still have a new highest day) but 1 or 2 days doesn't make a trend.

Oh, and yes I would agree that once we hit the 70% mark and things open up the trend may well change.

1631410643415.png
 
1.2% positive rate today
Last 7 days 1.08%

Of the testing cohort 1.2% positive (second highest positive rate in NSW since pandemic started - highest was 1.21% last week)
But only 105k tests today.

7 day avg for daily tests 130k

Are lower + numbers due to lower number of tests compared to rolling avg?

And if we apply 7 day positive rate avg to 7 day testing number avg, we get 1400 positive.

Maybe go with rolling avg of positive rate and rolling ave of testing numbers to get a slightly better? sense of where numbers are heading
 
Last edited:
105k tests is hardly a low number, it may be the lowest in the week but NSW test volumes are consistently high. Considering there is very little flu circulating and the summer like weather not many likely to have cold like symptoms.

Testing numbers on percentage of population is lower in other jurisdictions with delta, so seems odd to be overly concerned with NSW test volumes.

Vaccination volumes are growing, winter is behjnd us and less people will be feeling unwell. No need to be pessimistic unless you havent bothered to get jabbed.
 
1.2% positive rate today
Last 7 days 1.08%

Of the testing cohort 1.2% positive (second highest positive rate in NSW since pandemic started - highest was 1.21% last week)
But only 105k tests today.

7 day avg for daily tests 130k

Are lower + numbers due to lower number of tests compared to rolling avg?

And if we apply 7 day positive rate avg to 7 day testing number avg, we get 1400 positive.

Maybe go with rolling avg of positive rate and rolling ave of testing numbers to get a slightly better? sense of where numbers are heading
Small matter but the highest positivity rate for NSW so far was 1.29% (rounded to 2 decimal places) for the numbers reported on 5 September 2021
 
Its a possibility NSW will have 1000 covid"-present" deaths by Christmas. (best term I could think of to describe the daily reported death numbers.
 
The people 90% fully vaccinated NOW in Schofields, 90% in Edmondson Park, with Ku-ring-ga and Newport not far behind want to know when they can book their overseas trips having done the heavy lifting and all calls to be vaccinated.
They can easily home quarantine. In a few weeks time, there will be other LGA's over 90% and the people of Rose Bay demand action so they can book their Switzerland break. That overseas passport needs to be finalized now. You would expect Qantas to champion the 90 percenter's, but they are missing in action.

Source: Find the facts about COVID-19
 
Estimates are that about 11% of the UK population have been covid + whereas 0.2% of the Aus population
We cannot really extrapolate opinion/conclusions from UK data into the AU scenario (for this and a variety of other reasons)
Point taken, and when I first looked into the UK stats (two months ago) it certainly wasn't in the context of extrapolating the conclusions I came up with. But we had plenty of people telling us that vaccination was the way out but no clear understanding of what that meant in terms of when vaccination would start to help us get on top of the case numbers. So I went into looking at UK stats with a view to understanding if there was an obvious point there that vaccination seemed to start having an effect. And there was, in fact fairly dramatically a turnaround point. Agree not as a point for extrapolation but at least information that might assist.

At the time we had very little data ourselves to be able to start tracking if our own rise of cases would have a slowdown point ,but yes that was when I started tracking. In the absence of local data that was merely an indication of when we might see start to see some change, nothing more and yes, I totally agree it could have varied by a fair bit here but you can't subscribe to the view vaccination is our way out without acknowledging there is a point where vaccination will start to have have that effect (it's not an on/off switch). Yes this point may vary between countries but nevertheless there will be one for every country.

In retrospect though, while I've taken guidance for the prediction of others in my view of when things will turn around, it does seem to me that when we get to mid September and the week NSW health have predicted as the peak it was a pretty good finger in the air indicator. No more than that sure, but better than the estimations of some here, i.e. none.
 
Its a possibility NSW will have 1000 covid"-present" deaths by Christmas. (best term I could think of to describe the daily reported death numbers.
The roaring vaccination rates, are cutting that probability daily. We would really need emergency triage to get those numbers. But only preventable deaths matter. We then discount that number for the loosers that elected to take their chances (excluding genuine medical) by not seeking the jab early.

On the positive side, emergency vaccinations in the over 60's will probably cut deaths 40% over baseline, plus the blitz in Western NSW, plus the rollout to the vaccine snobs that hanged out.
And overwhelmingly most of the existing deaths were in the unvaccinated. I suppose ineffective commercials were to blame for that. Now delta is claiming children, the commercials need to emphasize this. Runny nose and sneezing is now a covid symptom, say 74%.

A better question to ask, how will long covid impact those hospitalised, or adversely affected, and the probability an unprepared WA and QLD will cope.
 
EXCLUSIVE OFFER - Offer expires: 20 Jan 2025

- Earn up to 200,000 bonus Velocity Points*
- Enjoy unlimited complimentary access to Priority Pass lounges worldwide
- Earn up to 3 Citi reward Points per dollar uncapped

*Terms And Conditions Apply

AFF Supporters can remove this and all advertisements

A down day for Vic after yesterday's high (450)


And today represents the last day for the popular NSW mini-series - one full of angst, apologies, broken glasses, hard questions, evasive answers and repitition.

And just as it all reaches a high point they cancel it.

I will miss Minister Health Hazards stumbles 😂, though haven’t watched last couple of weeks like many others.
 
Last edited:
I will miss Minister Health Hazards stumbles 😂, though haven’t watch last couple of weeks like many others.
Yesterday Mt Hazzard spoke so quietly explaining the latest on the spread of the virus that Mrsoatek kept asking "what did he say"!

The Health Minister might make a few stumbles, but everyone I speak to has a soft spot for him.
 
105k tests is hardly a low number
Whether a “low” number or not can be analysed by looking at rolling averaging over time and then comparing that day to the rolling avg then looking at the standard deviation.

The idea of no flu influencing testing numbers is irrelevant as that scenario applies essentially to all the data throughout the pandemic or at least the latest winter season.

So compared to the last 7 days the testing number for Saturday is approx 25000 lower than the rolling avg for the week.
The implication is that if an extra 25000 people were tested and assuming the same 1.2% positive rate then the expected positive would be 1400 or so.
It cannot entirely be extrapolated to say well what if 1 million people got tested? - ie to what degree does 1.2% hold?.

But it does give a sense that the daily numbers have a certain variability and uncertainty about them.

Some simplistic calculations to see if 105K is indeed a low number (there may be better ways of analysing this but thats for others):
The last 30 day rolling average for testing numbers = 141630 avg tests per day over last 30 days
The standard deviation for this is = +/- 24735

If using 15 days = 133779 avg tests per day and standard deviation +/- 18797

So Saturday's testing number of 105505 is approx 1.5 standard deviations from ( in this case below) the average over the last 30 days and indeed also for the last 15 days.
In fact Saturdays testing numbers (over the last month or so seem to be lowest compared to every other day of the week (though not entirely)
In rank order for day of week from highest to lowest avg testing number: Sunday, Wednesday, Friday, Thursday, Tuesday, Monday, Saturday

Speculative:
Saturday's Covid positive number therefore could be artificially lower that what it should be based on the above numbers.

(The definition of an Outlier is 3 standard deviations from the mean)
 
Last edited:
Well 105k tests is higher than on any single day last year or the first 6 months of this year. The point is you only need test if feeling unwell or directed to because of your job or being exposed.

On what basis do you think we need 125k+ tests a day?

Vic has a population 82% the size of NSW, yet have been testing about 45k per day, which is significantly lower. So if NSW is low per your criteria, you best not look at Vic or Qld.

Chill, lower (but not low) test numbers doesnt a disaster make.
 
Last edited:
So if NSW is low per your criteria
I don’t have a criteria or indeed saying that the tests numbers should be x.
I’m just doing some analysis of numbers, pointing out the issues about interpreting raw numbers, looking at data dispassionately and asking questions. Suggest read my post again.

It is entirely unclear what actually motivates people to have a test. Certainly there has been a recent change in testing recommendations. It is also unclear the proportion of people who had tests who were symptomatic and/or required to do so. There is no data on that.

Everyone who wants a test gets a test
There has been a rise in the positive rate since the commencement of the outbreak and a slight relative reduction in testing comparing the 15 day to the 30 day rolling avg - possibly relating to recommendation to only tested if there are reasons to (or other unknown reasons). However in spite of this the 105k remains 1.5 SD outside (below) of the rolling avg.

Delta outbreak has been nearly a 3 month event, so comparing recent testing data to testing 6 months ago is likely to give erroneous conclusions.

Did I say NSW has low testing numbers?. I’m suggesting that Saturday testing numbers are low compared to the 15 and 30 day avg and low compared to the other days of the week. This could be a reason why yesterday’s numbers are slightly lower. I don’t think you can compare with Vic.

Suggest again look at data dispassionately (yes - chill) rather than trying to get conclusions which suit a certain narrative.
 
Last edited:
[...] Testing numbers on percentage of population is lower in other jurisdictions with delta, so seems odd to be overly concerned with NSW test volumes [...]
And the point of this remark is ...?

Are not test numbers relative to infection cases numbers a key statistic?
 
There is no point comparing the daily volume of NSW and Vic Testing numbers at present as they are quite different beasts at present.

NSW has a large program requiring people to test for work related reasons that are all mixed into the one test pool along with those who are symptomatic or have a case/site exposure, and Vic in the main only has the latter.


Besides as vaccinations rise more and more vaccinated symptomatic people will not present for testing unless they feel unwell. This in turn will lead to less close contacts being directed to get tested.

The numbers to monitor will be hospitalisations, those treated at home, ICU and deaths. ie As with the flu where many people who have the flu never get tested.
 
Status
Not open for further replies.

Become an AFF member!

Join Australian Frequent Flyer (AFF) for free and unlock insider tips, exclusive deals, and global meetups with 65,000+ frequent flyers.

AFF members can also access our Frequent Flyer Training courses, and upgrade to Fast-track your way to expert traveller status and unlock even more exclusive discounts!

AFF forum abbreviations

Wondering about Y, J or any of the other abbreviations used on our forum?

Check out our guide to common AFF acronyms & abbreviations.
Back
Top