It will be interesting to read the full new report.
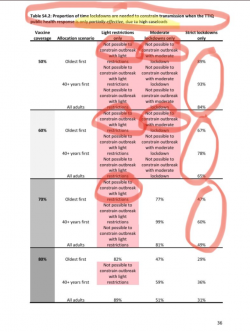
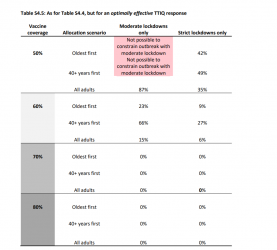
In the current (old) report there is a series of tables for the proportion of time that lockdowns will be needed, and/or other ongoing restriction settings.
• ‘Optimal’ TTIQ response, deemed achievable when active case numbers can be contained in the order of 10s or 100s;
• ‘Partial’ TTIQ response, deemed more likely when established community transmission leads to rapid escalation of caseloads in the 1,000s or beyond.
Active case numbers in NSW at present are 10,984. So when TTIQ is partially effective such in NSW at present you have:
View attachment 256317
So the above table was obviously not that attractive.
Whereas when you have optimally effective TTIQ you have the much more attractive outcome.
(Note there are various other tables for settings in between).
View attachment 256323
The two tables though do indicate the difference between a range of caseloads.
So it will be interesting read in the new report what the recommendations are for the level of caseloads that NSW is likely to be when 70% and 80% vaccination levels are reached.


